The Gap Between the Sign and the Reality
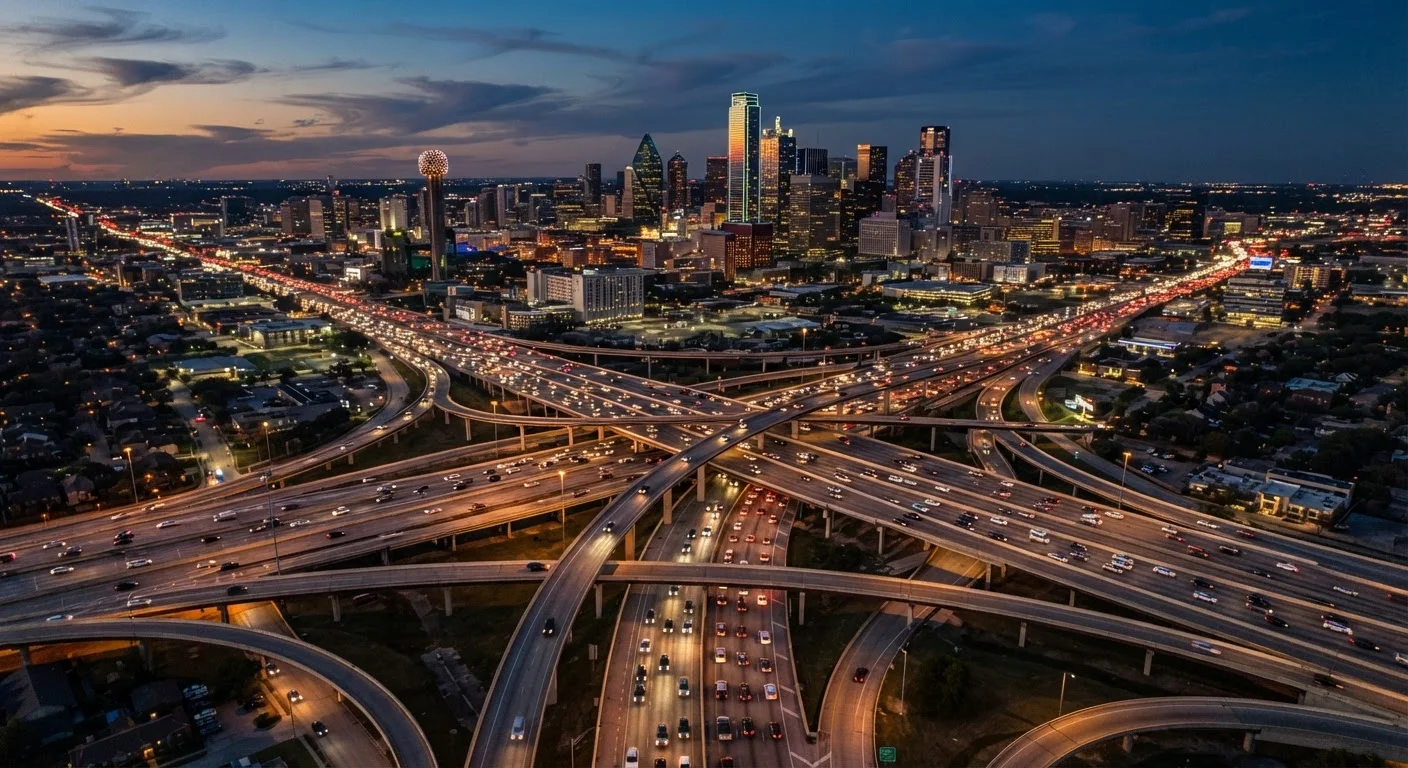
Pull up to almost any road in America and there's a white rectangular sign telling you how fast to go. Most drivers treat that number as the answer - the speed at which the road is safe and legal to travel. The legal part is accurate. The safety part is more complicated.
Speed limits in the U.S. are set through a process that blends engineering data, traffic surveys, state law, and local political input. The result is a number that reflects a negotiated decision, not a simple calculation of the maximum speed a human can safely navigate that road. Understanding that distinction matters - because it changes how you should actually use that sign.
For a broader look at the factors shaping crash risk across U.S. roads, see The Full Picture on Road Safety in America.
~37,000
U.S. traffic fatalities per year
The National Highway Traffic Safety Administration (NHTSA) has consistently reported approximately 35,000-40,000 annual traffic deaths in the U.S. in recent years, with speed cited as a contributing factor in a significant share of fatal crashes.
29%
Fatal crashes involving speeding
NHTSA data indicates that speeding - defined as exceeding the posted limit or driving too fast for conditions - is a factor in roughly 29% of all traffic fatalities annually.
85th percentile
Common speed limit engineering benchmark
The 85th percentile method - setting limits near the speed at which 85% of drivers naturally travel - has been widely used in U.S. traffic engineering since the mid-20th century, though its safety basis continues to be debated.
How Speed Limits Are Actually Set
The most common engineering method used to establish speed limits is the 85th percentile rule. Traffic engineers conduct a speed study - observing real vehicles on the road - and identify the speed at or below which 85% of drivers naturally travel. The logic is that this speed represents reasonable behavior for experienced drivers under normal conditions, and setting the limit near it reduces the gap between the posted number and actual traffic flow.
But the 85th percentile method has real limitations. It essentially codifies existing driver behavior rather than deriving a limit from crash data or pedestrian safety research. If most drivers are already speeding on a stretch of road, the method can produce a higher posted limit rather than correcting the problem. Some transportation researchers and safety advocates argue that limits - particularly in urban areas near pedestrians and cyclists - should be based more directly on survivability data: at what speed does a crash become fatal?
Beyond engineering, local politics play a role. Residents push for lower limits near schools; businesses on commercial strips sometimes lobby for higher limits to maintain traffic flow. State legislatures set maximum caps for highway types. The number on the sign emerges from all of that.
“Speed limits are not purely a scientific exercise. They reflect what engineers measure, what politicians decide, and what communities tolerate - and those three things don't always point in the same direction.”
— Federal Highway Administration - Speed Concepts: Informational Guide, U.S. Department of Transportation - Technical Reference Publication
Road Design Changes the Equation
The posted limit and the road's physical design don't always agree. Engineers aim to build roads where the geometry matches the intended speed, but that alignment isn't guaranteed - especially on older roads, roads that have changed over time, or roads with mixed uses they weren't originally designed for.
Key design factors that affect safe operating speed include:
- Lane width: Wider lanes encourage higher speeds and give more room for error. Narrower lanes require more precision and lower comfortable speeds.
- Curve radius: Tight curves demand significantly lower speeds to maintain vehicle control; the posted limit may not reflect the advisory speed for specific curves.
- Sightlines: Hills, vegetation, parked vehicles, or building setbacks can block a driver's view and reduce the safe stopping distance available at higher speeds.
- Shoulder and median presence: Roads without shoulders or with narrow medians offer less margin if a vehicle drifts.
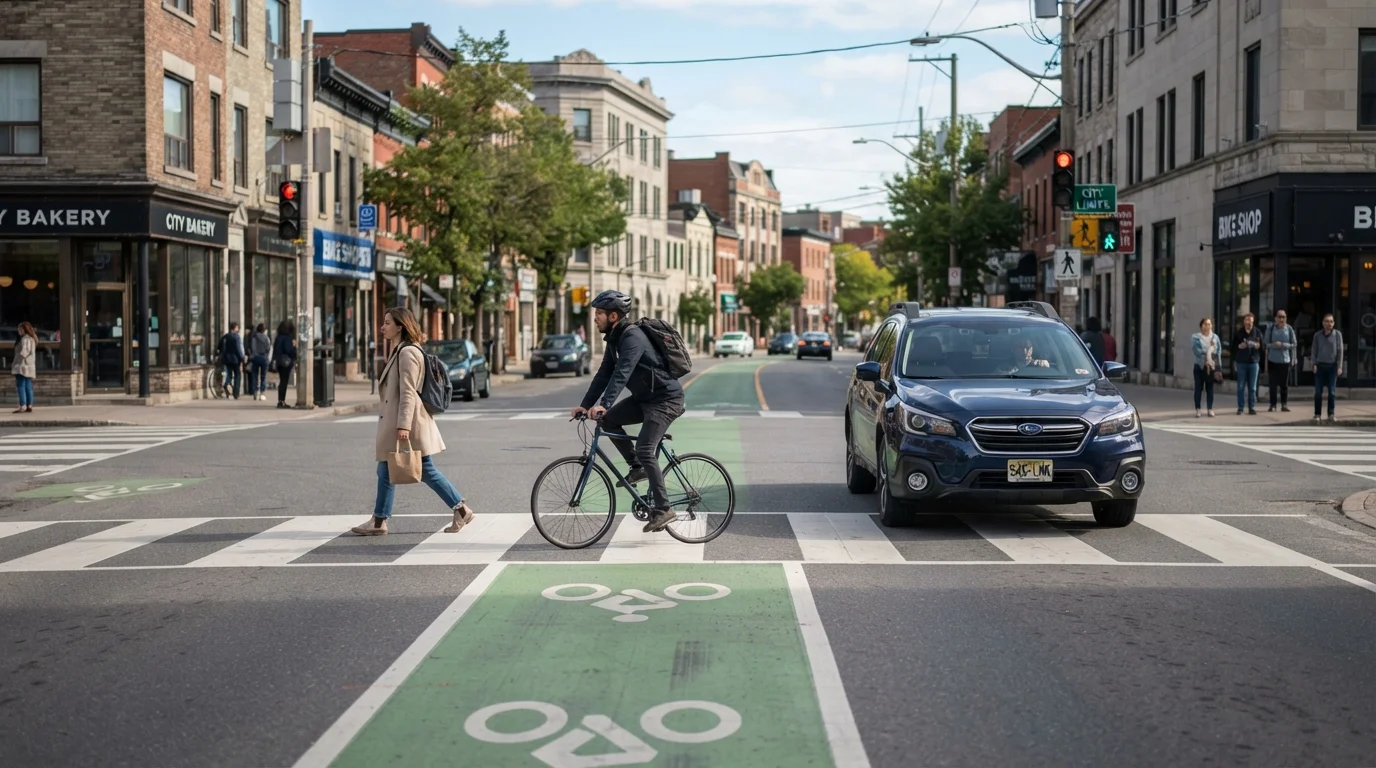
- Pedestrian and cyclist infrastructure: A road without sidewalks or bike lanes that nonetheless sees foot and cycling traffic is effectively operating at a higher risk level regardless of what the sign says.
This is why sharing the road with cyclists and pedestrians requires more than just staying in your lane - the road itself may not have been designed with their presence in mind.
Conditions That Make the Posted Limit Unsafe
Most U.S. states have what's called a basic speed law: a requirement to drive at a speed that is reasonable and prudent given actual conditions, regardless of the posted limit. That means if you're driving the limit in a whiteout blizzard, you may still be driving illegally - and certainly unsafely.
Conditions that routinely call for speeds well below the posted limit include:
- Rain, ice, or snow reducing traction and visibility
- Heavy fog or smoke limiting sightlines to a fraction of normal stopping distance
- Dense traffic where following distances compress and reaction time shrinks
- School zones and crosswalks during active pedestrian periods
- Road construction with altered lane positions and workers present
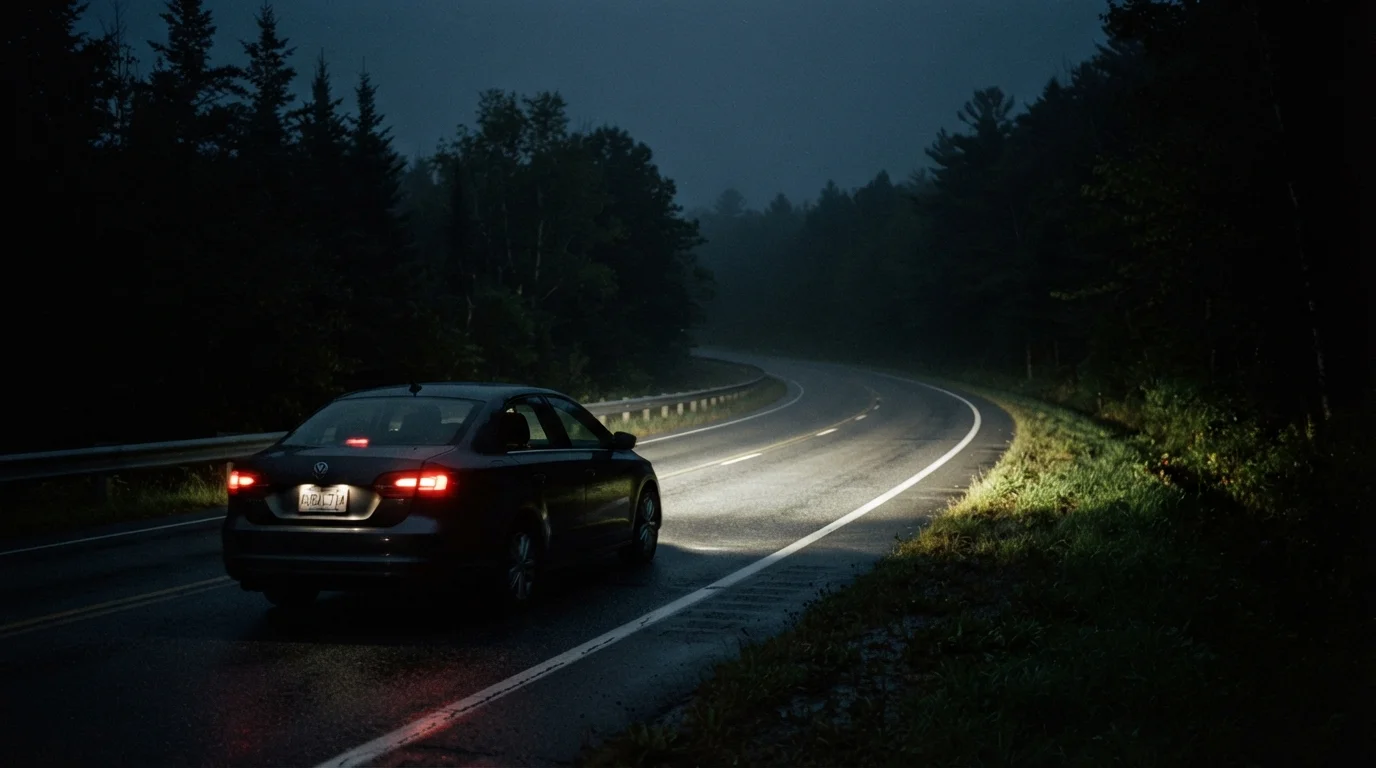
- Night driving on roads with limited lighting
Night driving myths often include the assumption that a well-lit road is a safe road - but illumination affects visibility, not road design, traction, or the unpredictability of other drivers.
Adjust Speed Before You Enter a Hazard
Slowing down mid-curve, mid-intersection, or after you've already entered a construction zone is less effective than reducing speed before you reach it. Scan ahead, identify changes in road environment, and adjust early. The posted limit can't account for what's around the next bend - you have to.
What This Means for How You Drive
Treating the posted speed limit as a floor - a number to hit rather than a ceiling to stay under - is one of the most common and dangerous misreadings of road signs. The limit tells you the maximum legal speed under ideal conditions. Your job as a driver is to assess whether conditions are actually ideal and adjust accordingly.
That means actively reading the road: checking sightlines, accounting for road surface, watching for pedestrians and cyclists, and maintaining a following distance that reflects reality rather than optimism. The 3-second following distance rule is a useful baseline - but it assumes dry pavement and alert driving. At higher speeds or in poor conditions, that margin needs to grow.
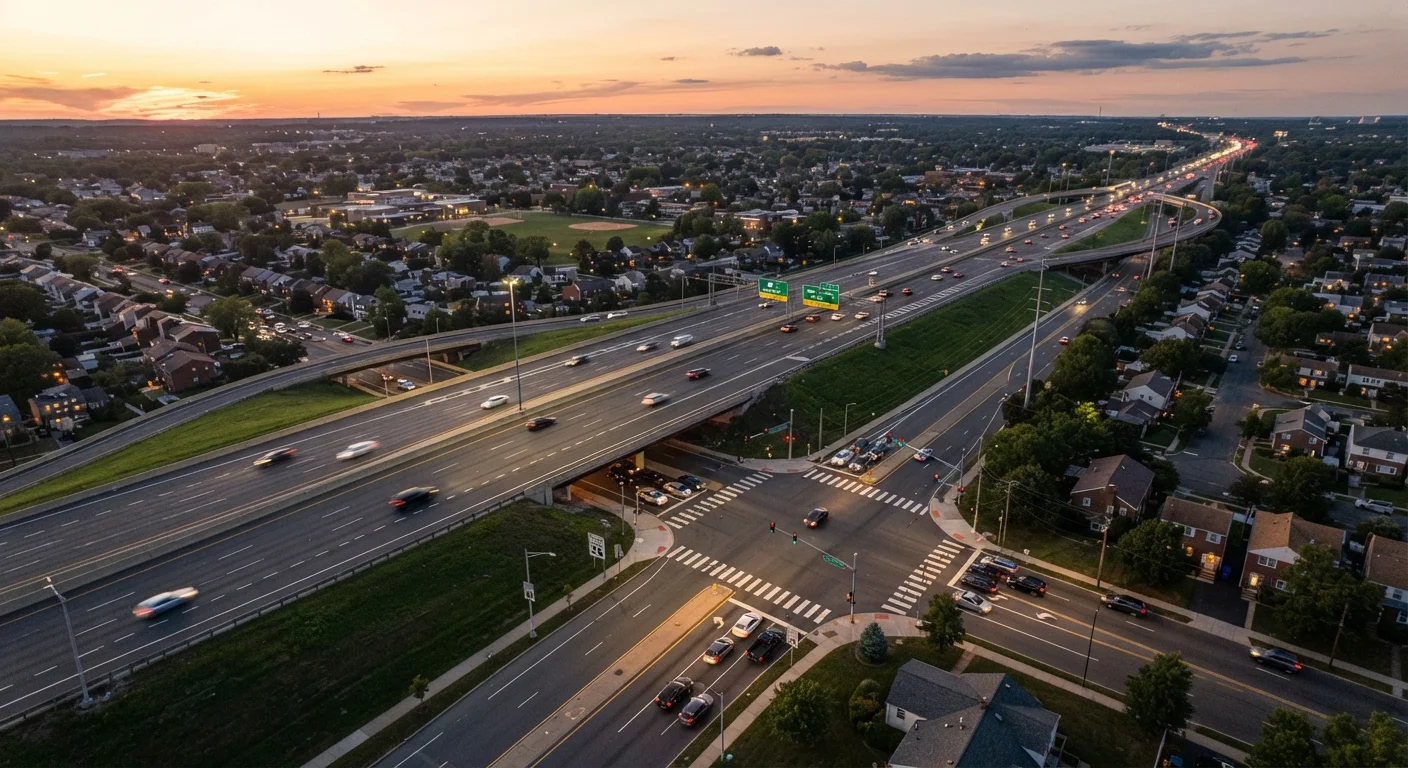
Speed is also a key variable in intersection risk. The habits that make intersections deadly frequently involve approach speeds that leave no room for error when another driver or pedestrian acts unpredictably. Understanding how posted limits are derived - and why they don't guarantee safety - is one piece of building genuine situational awareness behind the wheel.
For a fuller framework on how to approach all of this, defensive driving principles offer practical tools that go beyond speed management to overall road awareness.