
The State of U.S. Road Safety
The United States has one of the highest vehicle fatality rates among high-income countries. According to the National Highway Traffic Safety Administration (NHTSA), tens of thousands of people die in traffic crashes each year - a toll that has remained stubbornly elevated despite decades of safety improvements in vehicle technology and road engineering.
This isn't a fatalism argument. The U.S. has made real progress: fatality rates per vehicle mile traveled have dropped dramatically over the past 50 years. But compared with peer nations in Western Europe, fatality rates here remain significantly higher - a gap driven by a combination of driving culture, infrastructure design, speed norms, and public policy choices.
Understanding the full picture helps every driver make smarter choices. Road safety isn't just a government problem or an engineering problem - a substantial portion of harm is preventable through individual behavior.
~38,000
Annual U.S. traffic fatalities
NHTSA estimates roughly 38,000 Americans die in motor vehicle crashes each year, though the figure fluctuates annually.
~30%
Fatal crashes involving alcohol
According to NHTSA data, approximately 30% of all U.S. traffic fatalities involve a driver with a blood alcohol concentration above the legal limit.
2x+
Higher nighttime crash risk per mile
The fatality rate per mile driven is more than twice as high at night compared with daytime, based on NHTSA crash data analysis.
Where and When Crashes Happen
Crash data consistently shows that certain times, places, and conditions account for a disproportionate share of serious incidents.
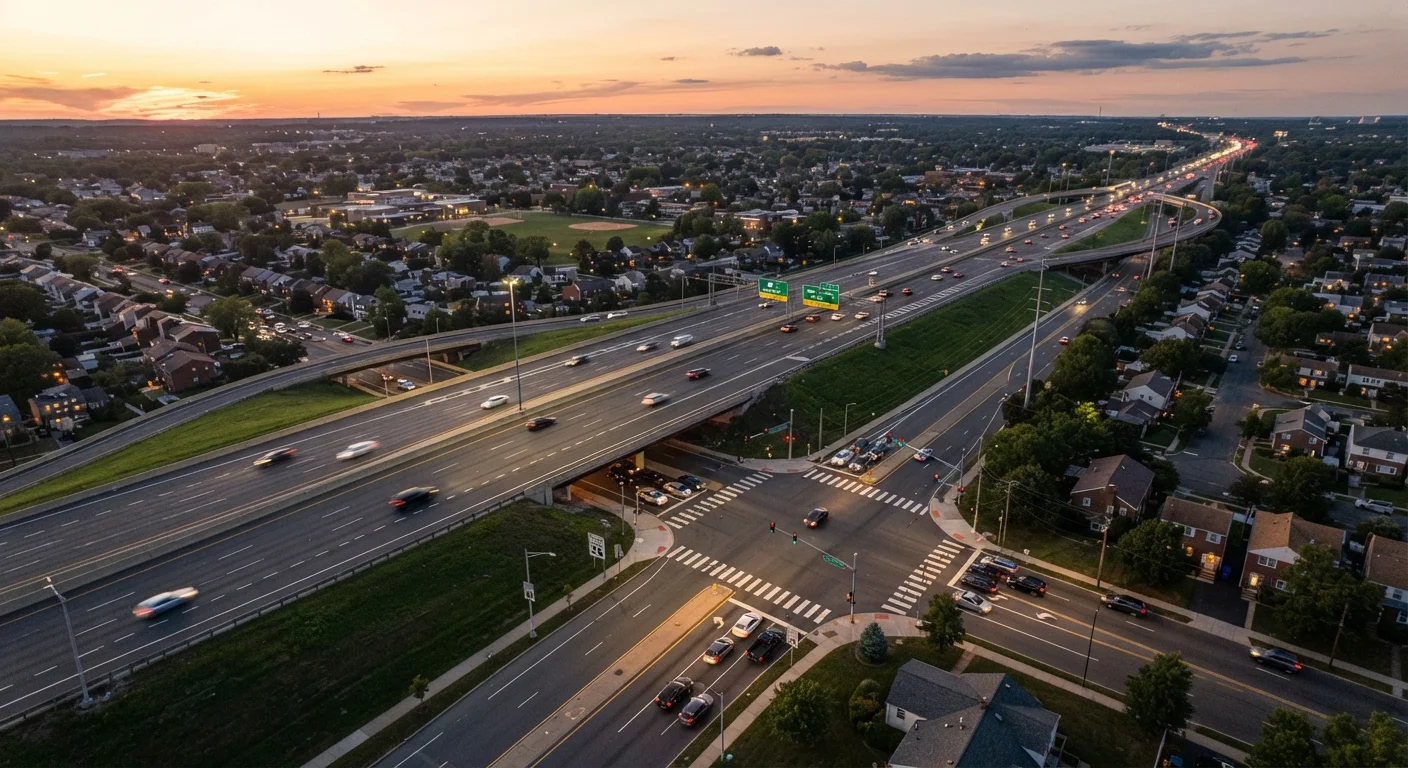
- Intersections: A large share of urban crashes occur at or near intersections - places where speed, attention, and right-of-way all converge. See what makes intersections so dangerous for a deeper look at the behaviors behind these collisions.
- Rural roads: Despite lower traffic volumes, rural roads account for roughly half of all traffic fatalities in the U.S. Higher speeds, less lighting, longer emergency response times, and narrower lanes all contribute.
- Nighttime driving: Fatal crash risk per mile driven is significantly higher at night. Reduced visibility, drowsy driving, and a higher prevalence of impaired drivers all spike after dark.
- Weekends: Friday and Saturday nights see a consistent concentration of alcohol-involved and speeding-related crashes.
Knowing when and where risk is highest doesn't mean avoiding those conditions entirely - it means adjusting your alertness, speed, and following distance when you're in them.
Risk Factors by Driver Type
Not all drivers face the same baseline risk. Age, experience, and physical condition create meaningfully different profiles.
Teen and Young Adult Drivers
Drivers aged 16-24 are overrepresented in crash statistics relative to their share of miles driven. Inexperience, risk tolerance, and peer influence all play a role. Graduated licensing programs - which restrict nighttime driving and passenger counts for new drivers - have shown measurable safety benefits in states that enforce them consistently.
Older Drivers
Drivers over 70 often have lower crash rates per licensed driver, but higher injury severity when crashes do occur. Slower reaction times, reduced peripheral vision, and medication effects are real considerations. The good news: most older drivers self-regulate effectively, reducing highway driving and avoiding high-complexity situations.
Commercial and Rideshare Drivers
Professional drivers log far more miles and face unique fatigue-related risks. Hours-of-service regulations exist for commercial truckers precisely because drowsy driving at scale creates catastrophic crash potential.
If you're driving with teen passengers, establish a clear no-phones rule before the trip starts - not after you're moving. Social pressure in the car is a major distraction multiplier for young drivers.
Research shows that crash risk for teen drivers increases significantly with each additional teenage passenger in the vehicle, largely due to social distraction and risk-taking behavior.
Older drivers should periodically request a medication review from their doctor specifically asking about driving effects - not all providers volunteer this unless asked.
Multiple common medications, including certain antihistamines, blood pressure drugs, and sleep aids, carry documented impairment effects that most patients aren't explicitly warned about in the context of driving.
The Big Three: Impairment, Distraction, and Speed
Across virtually every credible crash analysis, three factors dominate the list of contributing causes.
Impairment
Alcohol remains a leading cause of fatal crashes, involved in roughly 30% of all U.S. traffic fatalities according to NHTSA data. Drug impairment - including prescription medications and cannabis - is increasingly present in crash data. Even legal substances at therapeutic doses can impair reaction time and judgment.
Distraction
Phone use while driving is the most well-documented form of distraction, but it's not the only one. Eating, adjusting controls, and passenger interaction all divert attention. Research from the AAA Foundation for Traffic Safety has found that cognitive distraction persists for several seconds after you set a phone down - even when your eyes are back on the road.
Speed
Speed doesn't just increase crash probability - it dramatically increases injury severity. The physics are unambiguous: crash forces scale with the square of velocity. Going from 40 to 60 mph doesn't add 50% more crash energy; it more than doubles it. For a fuller look at how speed interacts with road design, see why posted speed limits aren't the whole story.
Hands-Free Is Not Risk-Free
Many drivers assume a Bluetooth call or voice assistant eliminates distraction risk. Studies from the AAA Foundation for Traffic Safety indicate that cognitive distraction from a phone conversation can persist for up to 27 seconds after the call ends. On a highway at 65 mph, that's nearly half a mile of reduced situational awareness. Use phone features sparingly while driving - even voice-activated ones.
Infrastructure and Road Design
Driver behavior gets most of the attention in road safety discussions, but infrastructure shapes outcomes just as powerfully. Road design either mitigates or amplifies the consequences of human error.
Key design factors that influence crash rates include:
- Median barriers: Divided highways with physical barriers between opposing lanes dramatically reduce head-on fatalities.
- Roundabouts: Studies consistently show roundabouts reduce fatal and injury crashes compared with traditional signalized intersections - primarily by eliminating high-speed T-bone and head-on conflict points.
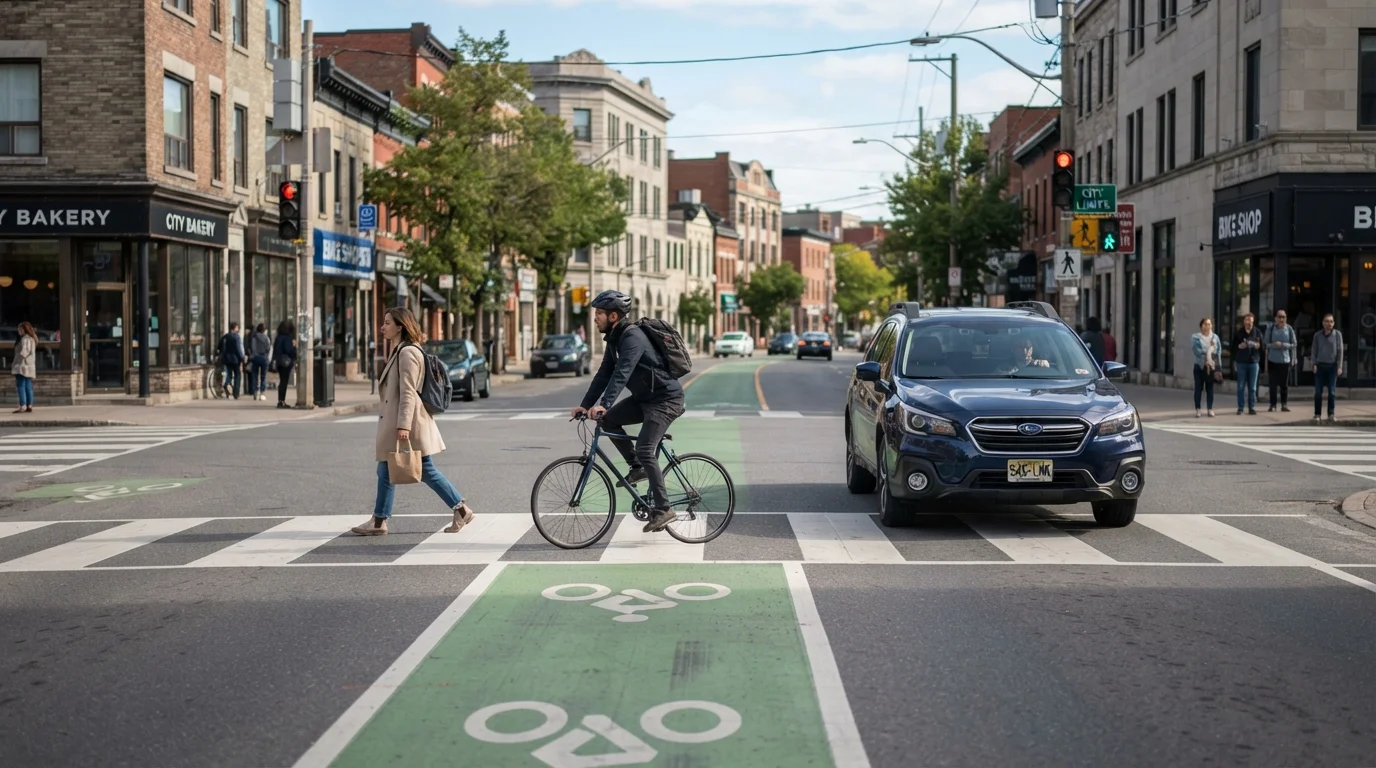
- Sidewalks and protected bike infrastructure: Where pedestrians and cyclists are mixed into vehicle traffic without protection, vulnerable road user fatalities are significantly higher. See how drivers and cyclists can share the road safely.
- Clear signage and road markings: Faded lane lines, absent signage, and poor lighting contribute to confusion and lane departures, particularly at night.
Drivers can't redesign roads, but understanding these factors helps explain why some roads feel harder to drive than others - and why extra caution is warranted on poorly designed stretches.
"Safe-Looking" Roads Can Be Deceptive
Wide, straight roads with few intersections often encourage speeds well above the posted limit - and above what the road can safely handle in a crisis. Single-vehicle run-off-road crashes are disproportionately common on exactly these types of roads. A road that feels easy to drive can still punish any loss of control harshly.
Habits That Actually Reduce Your Risk
The research on crash prevention is remarkably consistent. The behaviors below have strong, replicated evidence behind them - not just common sense.
- Wear your seatbelt every trip, every seat: Seatbelts reduce the risk of death in a crash by roughly 45% for front-seat passengers and 60% for light truck occupants, per NHTSA estimates. No other single action comes close.
- Keep a three-second following distance (more in bad conditions): Rear-end crashes are among the most common collision types. Adequate following distance is your primary defense.
- Put the phone away - physically: Out of sight reduces temptation. Hands-free is safer than handheld, but still not risk-free.
- Never drive impaired: This includes alcohol, cannabis, and any medication with a drowsiness warning. Plan ahead; arrange alternatives.
- Scan intersections before proceeding on green: Red-light runners are responsible for thousands of deaths annually. A one-second check costs nothing.
- Adjust for conditions: Rain, fog, construction zones, and high-traffic periods all warrant reduced speed and increased following distance - regardless of the posted limit.
Highway driving introduces its own demands. Understanding how to merge and change lanes safely is a skill that pays dividends every commute.
Finally, road safety habits connect to broader personal well-being. Chronic fatigue, stress, and poor sleep all degrade driving performance - factors worth addressing as part of any sustainable healthy daily routine.
This article provides general road safety information for educational purposes only. Always follow applicable traffic laws and consult official sources such as NHTSA or your state DMV for regulatory guidance specific to your area.