How Expense Ratios Actually Work
When you invest in a mutual fund or ETF, you're pooling your money with thousands of other investors. Running that pool costs money - paying analysts, maintaining compliance, and handling administration. The expense ratio is how the fund recoups those costs.
The math is straightforward: a fund with a 0.75% expense ratio deducts 0.75% of its total assets annually. If the fund holds $1 billion, it collects $7.5 million in fees. Your individual share of that deduction mirrors your ownership stake. On a $20,000 investment, 0.75% equals $150 in fees per year - but since the deduction happens at the fund level, your account balance simply grows slightly slower than the gross return would suggest.
This invisibility is what makes expense ratios a sneaky cost. Unlike a line-item charge on a bank statement, there's no moment where you consciously approve the fee. It compounds silently against you, year after year. The early investing mistakes that erode long-term returns often center on exactly this kind of overlooked drag.
0.03%
Lowest expense ratios available on broad index funds
Some of the largest index funds now charge as little as 0.03% annually, according to publicly disclosed fund prospectuses.
~$80,000
Potential 30-year cost of a 0.90% fee gap
Illustrative projection on a $50,000 initial investment at 7% gross annual return, comparing a 0.10% vs. 1.00% expense ratio over 30 years.
0.66%
Average expense ratio for actively managed U.S. equity funds
According to Morningstar's annual fund fee study, the asset-weighted average expense ratio for active U.S. equity funds is approximately 0.66%.
The Compounding Math That Makes Small Numbers Hurt
Compounding is the engine of long-term wealth - returns generate their own returns over time. But that same mechanic works in reverse when fees are involved. Every dollar lost to an expense ratio is a dollar that can no longer compound on your behalf.
Consider two investors, each starting with $50,000 and earning an identical 7% gross annual return over 30 years. Investor A is in a fund charging 0.10% annually. Investor B is in a fund charging 1.00% annually. After three decades:
- Investor A ends with approximately $357,000.
- Investor B ends with approximately $278,000.
That 0.90% difference in annual fees produces a gap of nearly $80,000 - not from bad market timing or poor stock picks, but purely from fees. The higher the balance grows, the larger the dollar cost of that percentage becomes in absolute terms. A fee that costs $500 in year one costs far more in year twenty on the same account.
This dynamic is analogous to spending leaks that quietly erode savings goals - the harm isn't in any single period, it's in the relentless accumulation across time.
Check the Expense Ratio Before You Invest
Before committing to any fund, look up its expense ratio in the fund's summary prospectus or on a financial data site. When comparing two funds with a similar objective, treat the expense ratio as a guaranteed cost that repeats every year. Favoring lower-cost options - especially for broad market exposure - is one of the simplest and most durable actions a beginning investor can take.
Active vs. Passive Funds: Where the Fee Gap Comes From
The fund industry broadly divides into two camps: actively managed funds and passively managed index funds. The difference has enormous implications for expense ratios.
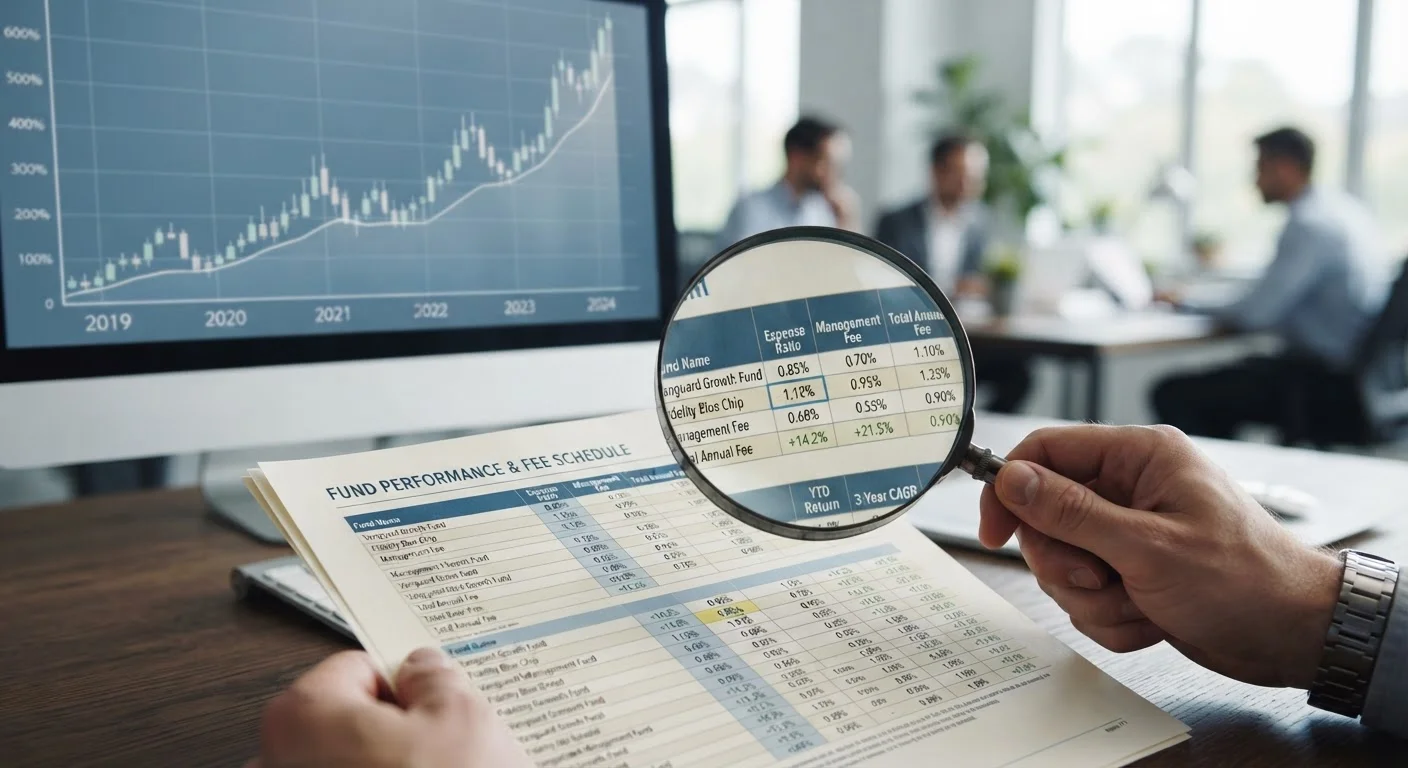
Actively managed funds employ portfolio managers and research teams to pick securities with the goal of beating a market benchmark. That staffing cost is passed on to investors through higher expense ratios, often ranging from 0.50% to more than 1.25%.
Index funds and most ETFs simply track a market index - like the S&P 500 - automatically. Because no team is actively selecting securities, operating costs are far lower. Many broad-market index funds carry expense ratios well below 0.20%, with some approaching zero.
The critical insight for investors: active management's higher fees must be overcome by sufficiently superior returns just to break even with a cheaper index fund. Historical data has shown this is difficult to achieve consistently over long time horizons, though past performance does not guarantee future results. Anyone building a budget-conscious investment approach - including those practicing dollar-cost averaging on a regular schedule - should weigh fees as a central variable, not an afterthought.
“In investing, you get what you don't pay for. The less you pay the investment management industry, the more you keep for yourself.”
— John C. Bogle, Founder of Vanguard and pioneer of the index fund
How to Find and Compare Expense Ratios
Every fund registered in the United States must disclose its expense ratio in its prospectus, a document the SEC requires before investors can participate. You don't need to hunt through fine print - the figure typically appears prominently in the fund's summary prospectus under a section labeled "Fees and Expenses." Major financial data platforms also display it alongside the fund's ticker symbol.
When comparing funds that serve a similar purpose - say, two S&P 500 index funds - the expense ratio is one of the clearest differentiators available. Other factors like tax efficiency, tracking accuracy, and minimum investment amounts also matter, but the expense ratio is the one guaranteed ongoing cost you can evaluate upfront.
Think of it as a fixed expense in your investment budget - it applies regardless of whether the market rises or falls that year. Paying attention to it before you invest is one of the most concrete actions any beginner investor can take to protect long-term returns.
This article is for general informational and educational purposes only and does not constitute personalized investment, financial, tax, or legal advice. Investing involves risk, including the potential loss of principal. Past performance does not guarantee future results. Consult a qualified financial adviser before making investment decisions based on your individual circumstances.